Throughout the world, European and American countries have improved the energy conservation, emission reduction and safety performance of automobiles through mandatory laws and regulations, and the rise of consumer electronics prompts consumers to gradually increase their requirements for automobile communication and entertainment functions, which will make automobile manufacturers' demand for electronic products continue to grow. From 2012 to 2016, the security control sector will have a compound growth rate of 10.2%, and other sectors will have a compound growth rate of 8.9%.
The two major trends in the future of the automobile industry are autonomous driving and new energy vehicles. In the era of automobile automation, automobile electronization is an important trend, and new energy vehicles are the representative of automobile electronization. In 2015, global vehicle sales edged up 1% to 91.65 million units, of which around 455,000 were electric vehicles. In 2016, there is a chance of a 50% increase to 700,000 units, which is much higher than the growth rate of overall vehicles. In 2015, China sold 171,100 electric vehicles, surpassing the 116,500 sold by the United States for the first time to become a global power in electric vehicles. China has listed the development of new energy vehicles as one of the top ten priorities of "Made in China 2025". In addition to the efforts of local automakers to develop electric vehicles, Internet companies are also testing the waters, and relevant domestic electric vehicle supply chain manufacturers have a chance to gain a seat in China's policy to promote electric vehicles.
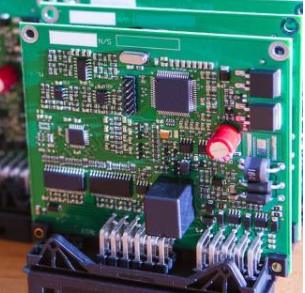
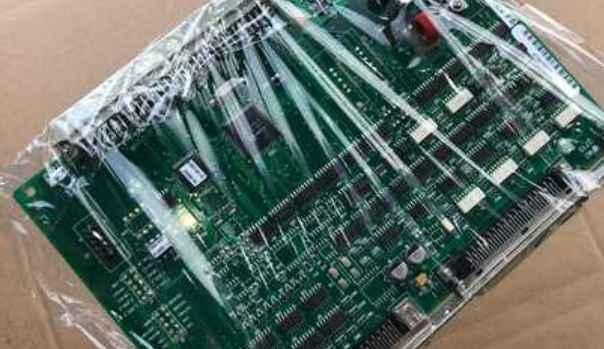
With the vigorous development of automotive electronics, PCB industry shows a vitality. PCB is widely used in automotive electronics, including power control system, safety control system, body electronic system and entertainment communication system. Therefore, the requirements for PCB are diversified, with large quantity and low price products coexisting with high reliability requirements: In automotive PCB, single-double panel, 4-layer board, 6-layer board and 8-16-layer board account for 26.93%, 25.70%, 17.37% and 3.49% respectively, accounting for about 73% in total. HDI, FPC and IC carrier board accounted for 9.56%, 14.57% and 2.38% respectively, accounting for about 27% in total. It can be seen that dual panel has a wide application prospect in automotive electronics.
Four subsystems of automotive electronics:
In 2016, the global automobile production reached 94,776,600 units, up 4.5% year on year, among which the automobile production in the Chinese market was 28.118,800 units, up 14.5% year on year. If the average value of bicycle PCB increases from $55 in 2016 to $65 in 2020 based on the current stock market, the new global demand for automotive PCB is about $950 million, equivalent to 19.2% of the automotive PCB market in 2016. The industry CAGR from 2016 to 2020 is about 4.51%.

How to analyze PCB impedance and loss
The impedance and loss of PCB are crucial to the transmission of high-speed signals. In order to analyze such a complex transmission channel, we can study its impact on signals through the impact response of transmission channel.
The impulse response of the circuit can be obtained by transmitting a narrow pulse. The ideal narrow pulse would be a narrow pulse of infinitely narrow width, of very high amplitude. As the narrow pulse travels along the transmission line, the pulse will be broadened, and the shape of the broadened pulse will depend on the response of the line. Mathematically, we can convolve the channel impulse response with the input signal to get the waveform of the signal after transmission through the channel. The impulse response can also be obtained by the step response of the channel, and since the differential of the step response is the impulse response, the two are equivalent.
It seems that we have found a way to solve the problem. However, in the real situation, there is no ideal narrow pulse or infinitely steep step signal, which is not only difficult to generate but also difficult to control the accuracy. Therefore, in the actual test, sinusoidal wave is used to get the frequency domain response, and the corresponding physical layer test system software is used to get the time domain response. Sinusoidal waves are easier to generate than other signals, and their frequency and amplitude accuracy are easier to control. vector networkanalyzer (VNA) can accurately measure the reflection and transmission characteristics of the transmission channel to different frequencies in the frequency range of up to tens of GHz by means of sine wave sweep frequency. The dynamic range is more than 100dB. Therefore, in modern high-speed transmission channel analysis will mainly use vector network analyzer to measure.
The reflection and transmission characteristics of the measured system for sinusoidal waves of different frequencies can be expressed by S-parameter, which describes the transmission and reflection characteristics of the measured part for sinusoidal waves of different frequencies. If we can obtain the reflection and transmission characteristics of the transmission channel for sinusoidal waves of different frequencies, we can theoretically predict the effect of the real digital signal passing through the transmission channel, because the real digital signal can be considered to be composed of many sinusoidal waves of different frequencies in the frequency domain.
For a single end transmission line, it contains four S parameters: S11, S22, S21, S12. S11 and S22 reflect the reflection characteristics of sine waves of different frequencies at port 1 and port 2, respectively. S21 reflects the transmission characteristics of sine waves of different frequencies from port 1 to port 2, and S12 reflects the transmission characteristics of sine waves of different frequencies from port 2 to port 1. For a differential transmission line, the S-parameter is more complex, with 16 ports in total, because there are four ports. Generally, differential transmission lines are measured with vector network analyzers with 4 or more ports to obtain their S-parameters.
If 16 S parameters of the measured difference line are obtained, many important characteristics of the difference line have been obtained. For example, the parameter SDD21 reflects the insertion loss characteristics of the difference line, and the parameter SDD11 reflects the return loss characteristics of the difference line.
And we can go further and get more information by doing the inverse FFT transformation on these S parameters. For example, the parameter transformation of SDD11 can obtain the time-domain reflection waveform (TDR:Time DomainReflection), through which the impedance changes on the transmission line under test can be reflected. We can also do the inverse FFT transformation on the SDD21 result of the transmission line to get its impact response, so as to predict the waveform or eye pattern of digital signals with different data rates after passing through the pair of difference lines. This is all very useful information for digital design engineers.
It can be seen that the vector network analyzer (VNA) is used to measure the transmission channel of digital signals. On the one hand, the analysis method of radio frequency and microwave is used for reference, and the transmission channel characteristics can be very precise in the frequency range of tens of GHz. On the other hand, through some simple time domain transformation of the measurement results, we can analyze the impedance changes on the channel, the impact on the real signal transmission, etc., so as to help the digital engineers in the early stage can judge the quality of the backplane, cable, connector, PCB, etc., instead of having to wait until the last signal problems to rush to deal with.


